As mentioned in the previous article, I'd like to reach above 40km in altitude with my next HAB. I have already written about the weather conditions I am currently waiting for, and in this article I'd like to summarize what my thoughts have been and what I have done hardware-wise. The targeted altitude was not the only goal I had with this project. These balloon flights are an opportunity for me to learn something new in fields I don't know much about. In that spirit, I wanted to get deeper with electronics and thus I decided, based on a number of similar well documented projects, to design my own tracker. Another goal was to get a video from the whole flight this time.
So, TT7-40 would be composed of a lightweight tracker powered by a single AA battery, a lightweight HD camera and a Hwoyee 1600g balloon (as used in all the previous record breaking flights). The targeted weight of the payload was planned to be about 150g. The ground tracking station would be the same as with TT7 with only minor changes. An SDR dongle and a homemade Yagi antenna. The tracker would operate in the 434MHz band.


After studying a number of custom-made trackers (my gratitude to Anthony Stirk, Chris Stubbs and Steve Smith for making their schematics freely available) and datasheets of different parts I settled on using an ATmega328P microcontroller, a Ublox MAX-7C GPS module, an RFM22B transmitter and an MCP1640 boost converter. After a few tutorials in Eagle PCB layout editor, I got to several hours of drawing, wiring and checking datasheets. In the end, I ended up with what can be seen in the pictures above. Basically all the proper wiring is sufficiently described in each part's datasheet so all I had to do was make sure I replicate it without any mistakes, but Eagle helps you with that as it can. The only non-standard thing I had to do was the GPS antenna. I couldn't come across any strip antennas for a reasonable price that the others had used, however, the GPS module seller kindly provided me with a couple of patch antennas free of charge. I only had to properly incorporate it into my design which made the board a little crowded, because the antenna took up 2.5x2.5cm. It also added weight substantially (9.5g), but as they say 'don't look a gift horse in the mouth'.
With the board finished, I began looking for a manufacturer. Initially, I checked the local options, but it seemed the Czech manufacturers weren't oriented on small non-commercial series. The Chinese, on the other hand, offer a variety of options, so eventually I decided for
http://dirtypcbs.com/ who provide a +-10 board protopack of 5x5cm PCBs for \$14 with free international shipping (or 10x5cm for \$25). From ordering to the delivery it took about 21 days.
For quickly visualizing the Gerber files that the manufacturer requires, one can use
http://gerblook.org/.
For anyone interested, here are the Eagle files:
TT7-40 v1.1.brd and
TT7-40 v1.1.sch.
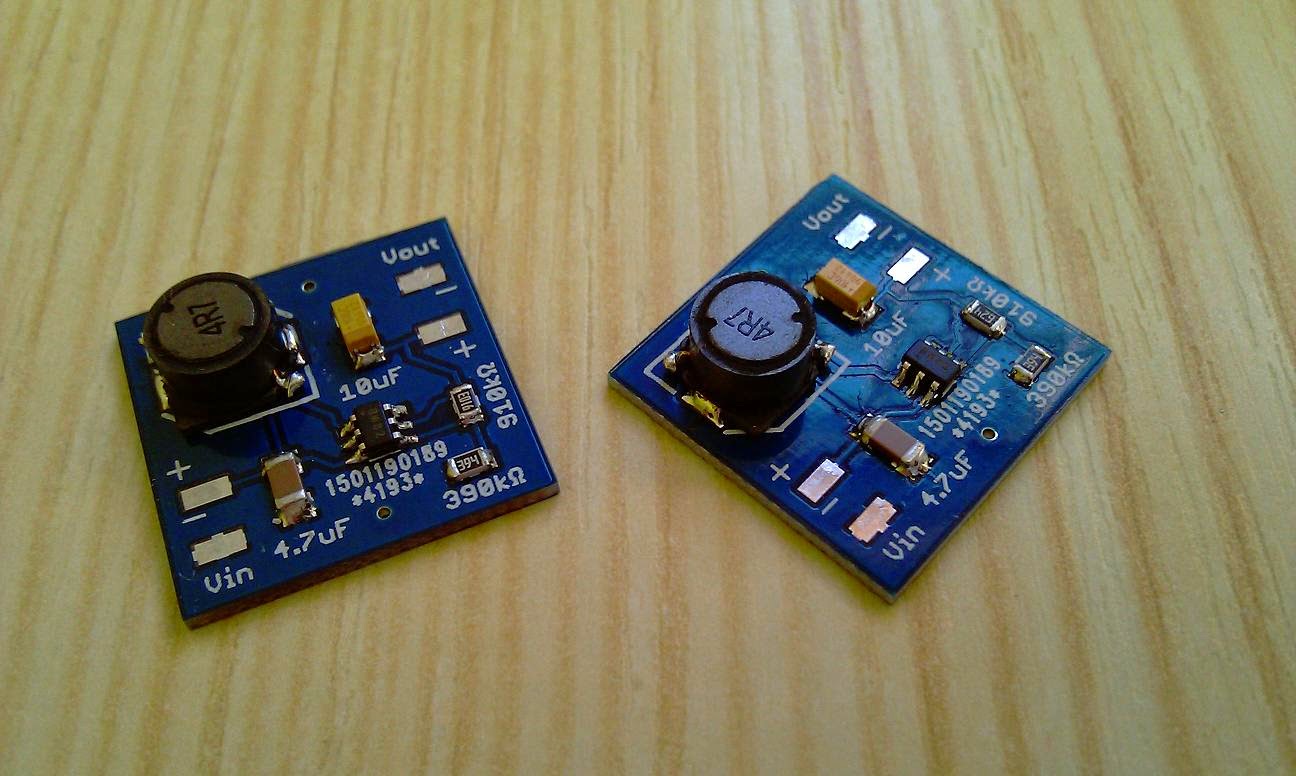
Here are the finished PCBs. One weighs about 6.5g. Initially, I chose 1.6mm thickness. After having them in my hands, I could've gone with thinner.
Verifying that the routes do what they are supposed to.
And here is the tracker with all the parts soldered on. It's dimensions are 70x30x16mm. The thickness is mainly due to the programming pins sticking out.
Verifying that the step-up converter works properly. The tracker operates on 1.98V. That is possible, because the minimal operating voltages for the individual parts are 1.8V for ATmega328P, 1.8V for RFM22B as well and 1.65V for Ublox MAX-7C. At this voltage the micro-controller runs at 4MHz as opposed to the Arduinos that usually run on a 16MHz crystal.
Now, unlike regular Arduinos this board doesn't have a USB connector and thus the ATmega has to be programmed via SPI. For that, I needed a programmer. Luckily, I came across a tutorial about using another Arduino with it's USB interface to program a blank ATmega. However, as I mentioned, my tracker operates
on 2V while the Arduino runs a 5V logic. For that I ordered a couple of logic converter boards from Ebay.
And here's my ATmega programmer utilizing an Arduino NANO, the logic converter and a bunch of wires with stickers. All one needs to do is to upload 'ArduinoISP' sketch into the Arduino, connect the programmer to the ATmega and instead of uploading via the 'Upload' button in ArduinoIDE using the 'Upload Using Programmer' option to program the targeted micro-controller. It's also important not to forget to setup the ArduinoIDE ahead of uploading so it knows to what kind of a board it will be uploading to, which port it should use and which programmer it should employ ('AVR ISP' for programming the NANO and 'Arduino as ISP' for programming the blank ATmega). Concerning the 'Board' option, if you are uploading to a non-standard board you may have to create a record of that board in 'boards.txt' file inside the ArduinoIDE main directory (..\Arduino\hardware\arduino\boards.txt).
##############################################################
atmega328p4mhz.name=ATmega328P 4MHz
atmega328p4mhz.upload.protocol=arduino
atmega328p4mhz.upload.maximum_size=30720
atmega328p4mhz.upload.speed=57600
atmega328p4mhz.bootloader.low_fuses=0xFD
atmega328p4mhz.bootloader.high_fuses=0xDA
atmega328p4mhz.bootloader.extended_fuses=0xFE
atmega328p4mhz.bootloader.path=atmega
atmega328p4mhz.bootloader.file=ATmegaBOOT_168_atmega328.hex
atmega328p4mhz.bootloader.unlock_bits=0x3F
atmega328p4mhz.bootloader.lock_bits=0x0F
atmega328p4mhz.build.mcu=atmega328p
atmega328p4mhz.build.f_cpu=4000000L
atmega328p4mhz.build.core=arduino
atmega328p4mhz.build.variant=standard
##############################################################
This is what I used to program the tracker.
This method works for uploading a sketch to the ATmega. However, if you have a blank ATmega you need to setup its fuses first. Initially, the ATmega is setup to operate from its internal oscillator and with a few other settings you might want to change. To change these factory settings, I advise you to use this calculator to find out the proper fuse settings for your particular purpose
http://www.engbedded.com/fusecalc/ and micro-controller. To access the fuses I used AVRDUDE. It is a command line utility that if you have ArduinoIDE installed, you should have as well.
Simply open the Command Line, connect the programmer with the ATmega to a USB port and write:
avrdude -P COM4 -b 19200 -c avrisp -p m328p -v
This will output the present fuse settings as can be seen in the picture above. Naturally, you have to modify the command to your specific purpose. If for example your are using COM1 instead of COM4 as in my case, or if you are using a different programmer, or if you are programming a different micro-controller (m328p stands for ATmega328p).
Next, I moved onto burning the fuses. There are three (low, high and extended) and by now you should know to what you want to set them (the format is a two digit hexadecimal number such as '0xFD'). To burn the low fuse I used this command:
avrdude -P COM4 -b 19200 -c avrisp -p m328p -U lfuse:w:0xFD:m
Then for the high fuse this command:
avrdude -P COM4 -b 19200 -c avrisp -p m328p -U hfuse:w:0xDA:m
And for the extended fuse this one:
avrdude -P COM4 -b 19200 -c avrisp -p m328p -U efuse:w:0xFE:m
In the end, I verified the settings using the first command that outputs the current fuse settings. As you can see, the fuses are changed. One little thing, the output says the extended fuse is set to 0x06 instead of 0xFE. It does this for some reason, but in reality they mean the same, so the fuses are set correctly (in case of 0xFF settings it would say 0x07). Now, what exactly happened to the ATmega? The micro-controller now expects a 4MHz crystal at its inputs (3-8MHz actually) and operates with the brown-out detection level decreased to 1.8V allowing a 2V operation as in the case of my tracker.
After this, I could proceed to developing the actual code that would run the tracker. Here, I once again used all the code examples made public by people around UKHAS, Anthony Stirk, Chris Stubbs and all the other contributors to make mine work. I began with simple scripts to find out whether the individual components even work, because up to that point I could only measure the current drawn from the battery which suggested that at least the GPS module was alive. First, I made the RFM22B transmit a carrier, then tried simple RTTY with a preset text message and with that functioning I turned my attention to the GPS communication.
At first, the ATmega would communicate with the GPS module, then it would construct the telemetry string and finally it would transmit it. Step by step like this. In this configuration there were basically two phases with different current draw. About 80mA during the GPS communication and around 150mA while transmitting.
The pictures above show lower current draw because of the battery used. The GP Super battery used in the first case initially provides about 1.4-1.5V while the Energizer Ultimate Lithium batteries initially operate at about 1.75-1.8V. Thus the boost converter needs to draw less current to output the tracker's operating voltage of 1.98V.
However, as I mentioned in the beginning, I'd like these projects to teach me something new each time and in each field, so I decided to dig into interrupts and implement Anthony Stirk's routine in my code. After this adjustment, the tracker would transmit continuously without the need to pause for the GPS communication to take place. In this continuous TX configuration the current draw stayed at 130mA for the GP Super battery and about 90mA with the Energizer which given its 3000mAh capacity didn't look bad at all.
Now, lets turn attention to the camera. I decided to order a Mobius ActionCam after I stumbled upon a HAB video captured by this very cam. It is light weight (41g originally), small, can capture wide-angle HD video and it is HAB verified. The problem is its small 520mAh LiPol battery. I could expect about 80 minutes of video time, or rather just 40 because of the low temperatures.
Excited by the success with building the tracker, I decided to solve this problem similarly and build a boost converter for two AA Energizer batteries. Those would with their 3000mAh capacity provide enough video time for the whole flight.
The converter utilizes an MCP1640 and outputs 4V. It is basically the same step up converter that is used on the tracker just with a different settings.
In this setup, the hardware weighed 98g. Sufficiently little to get easily within the 150g limit with a complete payload.
However, my optimism was premature. I knew that the camera gets fairly hot when recording and wanted to know how it would behave in a small space encapsulated by polystyrene. So I set up a test with a thermometer. Just as I went to check the progression of the test I noticed that the camera wasn't recording. It turned out that after a couple of moments it would always turn off.
Eventually, I found out that although the camera draws about 300-350mA on average, momentarily the peak current can reach up to 450-470mA. That was beyond the boost converter's capabilities.
Consulting the datasheet, I tried one last attempt by decreasing the voltage output to 3.7V and using a bigger capacitor at the output, but it didn't make much difference.
One of the reasons I went with this power solution was its weight. The two AA batteries would weight only about 28g plus a few grams for the converter, wiring and a battery case. Since this was no longer an option, I had to look elsewhere. Given the insufficient power problem, I wanted to stick with a verified solution and at the cost of a higher weight I went with a 2400mAh LiPol battery. That should give me at least 4-5 hours of video time (using a 64GB SD card) even at low temperatures. Plenty for a up and down HAB.
This hardware setup weighed 115g.
With the hardware decided, I carved out an initial shape of a payload box from a polystyrene piece, and set up to test the camera's temperature. In an ambient temperature of 11.5°C the temperature inside the payload rose to 42°C in about an hour while the documentation states that the camera should not be run in temperatures exceeding 47°C. In a later test in an ambient temperature of 1.75°C, the temperature inside the payload settled at about 28°C after a 2 hours of slower rise. Since the temperatures awaiting the payload in the air are properly below 0°C, it should be ok. I should only be careful not to delay the launch to much with the camera already turned on, and if possible, get to the landing site as quickly as I can to turn the camera off.


With the payload slowly shaping up, I did a first long distance test. I left the payload transmitting in the garden and drove off to a nearby hill 4.6km away. I had made a coax cable collinear antenna for 434MHz and I wanted to test it and also the performance of the small whip antenna provided with the DVB-T dongle I use as a radio.
They both worked fine, so now I have a choice which one to use. The original Yagi I had made for my first balloon tends to be a little clumsy to move about, so will be a backup.
In the mean time, I kept working on the tracker and did some testing. Analysing the data I gathered, I found out there was an error in about 6% of communications between the GPS module and the microcontroller. Given the fact that I used hardware serial for the communication, the fact I couldn't find any critical differences between my code and the codes of others, and the fact that it happened in only about 6% of times, I decided to put up with it and leave the issue. However a real problem surfaced when I got to do freezer testing to see how it would cope in below zero temperatures.


At some point in the freezer (-18°C), the RFM22B transmitter simply stopped transmitting RTTY (two alternating frequencies - one for bit 0 and the other for bit 1) and kept transmitting only on one frequency. First, I tried implementing a regular radio reset after about 15 telemetry strings (every 2 minutes). Initial tests seemed promising, but in the end the issue occured again. The problem was baffling, because right after a hard reset (taking out the battery) the tracker would work again immediately.
I decided to take upon the issue from a different angle and use the camera's heat to keep the tracker warm. To do that, I abandoned my initial intention to attach the transmitter to the camera box from outside and put the tracker as close to the camera as possible.
For the time being, that seemed to do the trick. The camera's heat maintained about 5°C on the RFM22B chip as can be seen in the chart above. You can also see the moment the camera's battery died and the temperature started to decrease until the moment I took it out off the freezer.

Temporarily being satisfied with the tracker's performance, I turned my attention to other things. Last time I tracked my balloon, it wasn't exactly smooth. With each drive to another place, I had to pack the whole tracking station, turn everything off (due to a limited battery power - it died towards the end anyway..) and then set it all up again. This time, I'd like it to be more tranquil. Inspired by what I could see others do, I set up a chase car. I tested the reception of the small whip antenna provided with DVB-T dongle driving around the town with the transmitter placed in my garden. It gave me the impression that with the balloon above it might work just fine. If not, then I'll simply stop and unpack the other antennas, but this time, I won't forget a car charger for the notebook.


Now, with the payload's new layout, I had to rethink the tracker's antenna. I needed to keep the transmitter well within the isolation, so I had to adjust the antenna with a coax cable and extend it out off the payload.
New antenna meant another long distance test and another freezer one too. The distance test went fine and the freezer test as well. This time the temperature on the RFM22B decreased to and stayed at about -1°C with the tracker working fine for the whole 4 hours of the test.
Later on, I was basically finishing work on the payload and just for the sake of it wanted to do one more freezer test with a complete payload. At first, all went well, but after about 3.5 hours the tracker suddenly went to carrier again and did not recover. That was quite a blow, because I considered that issue to be solved. At that point, I was even considering a plan B and somehow try to connect the tracker to a Si4060 transmitter I had to have delivered at that time. Out of despair, I was googling after similar issues and came across someone blogging about coating the RFM22B with a tape to isolate it from possible condensation. I thought I had nothing to loose, so I covered it by a few layers of electric tape and threw the bare tracker without the polystyrene box into the freezer.

To my surprise, the radio worked without a problem even at -15°C as measured on the chip. The chart above shows a previous full payload test at the left during which the radio died, and then the bare tracker's performance with the tape.
This is a full payload test the following day. RFM22B covered in tape and functioning fine at -1°C on the chip. After about 4.5 hours the camera's battery died (I did not recharge it after the last shorter test), the temperature in the payload began to decrease and I took it out off the freezer. This is to this point the last test (successful), however I'll probably do another one just before the launch. Hopefully, I won't have to write an update about the situation and everything will work.

With the payload hopefully completed, I did a final weighting. A hexagonal 30cm in diameter parachute with a string to be attached to the balloon weighted 6g. This time, I'll tie the parachute to the balloon so it will ascent upside-down and will turnover after the burst when the drag kicks in. Regarding the expected descent time and speed, I calculated an interval of most likely situations. The problem is that one can't know how much of the balloon will tear off in advance. That than affects the weight of the system and the area contributing to the overall drag. So my expectations are somewhere between 22 minutes and 7.7m/s impact speed and 38 minutes and 3.3m/s impact speed for a descent from 41000m.
A video recording solution that is a little heavier than my original plan.
About 14m of string to connect the payload to the balloon. I might shorten it a little bit in the end and reduce the weight a little.
The payload's lid with the string. I was racking my brain for some time to come up with a solution that would maintain the insides of the payload easily accessible while appending the payload reliably. In the end, I decided to tie the string to the lid only and then use an electrical tape and wrap it tightly around the payload and the lid when it's all ready to be launch.
Due to the way the tracker is placed inside the payload, I could no longer weigh it separately without desoldering the antenna first. So this is the joint weight.
And here is the complete payload. It got a little over of what I intended, but 160g is still good. Assuming the same amount of helium, a 10g weight difference represents only about 1% change in the average ascent speed.
Here you can see the final transmitter antenna. It's a ground plane antenna and the 30-40° bent of the ground plane wires should lead to a 50
Ω impedance match to the transmitter's impedance.
The tracker will use one Energizer Ultimate Lithium AA battery. These batteries have been many times verified on different HABs. The datasheet states that the battery is capable of retaining it's 3000mAh capacity all the way down to -40°C.
The balloon is ready as well. A Hwoyee 1600g ordered from Random Solutions.
One more thing intended to make the subsequent tracking smoother than the last one. Last time, I had problems accessing the habitat tracker website. I guess partially because of my archaic notebook that was completely overloaded by running the SDR and partially by a terrible mobile internet connection. All in all, I was receiving and uploading the telemetry, but I couldn't check the map and find out where exactly the balloon was. So this time, I printed out a couple of maps where I marked the main GPS coordinates. That should provide me with a quick check on the balloons whereabouts. From the point of view of modern technology, it is sort of a prehistoric solution, but it might spare my nerves.


So to summarize. I guess the biggest unknown is the behavior of the RFM22B transmitter in low temperatures. Nevertheless, I did what I could to minimize the danger of it malfunctioning. Studying the internal temperature profiles of a number of HABs (czANSO, SB3, UGGY in the charts above) that I came across, there are usually two local minimums. One during the ascent. Not that the temperatures would rise that significantly at high altitudes, but the pressure does drop significantly, and thus the internal hardware even manages to increase the temperature inside the payload a little bit. I've wondered how to model the influence of the pressure drop on the system's ability to loose/retain heat. I've actually spent a lot of time searching for equations and calculation examples, however unsuccessfully. The second local minimum comes during the descent at about 8000m where the payload is once again exposed to very low temperatures and higher pressure.
Other than that I am waiting for the end of June for the desired weather conditions (seasonal high pressure at high altitudes) as described in the previous article. When the time comes, I'll start looking for a period of days with a suitable wind pattern (preferably the overall trajectory direction to the west with the distance from the launch site to the landing site not exceeding 100km). Then, when the launch day comes, measure the amount of helium properly, be careful not to accidentally turn the camera off while encapsulating the payload, and then pray the balloon doesn't land on the top of a tree. :-)
Now, given the payload weight of 160g, I am targeting an ascent speed of 3.9m/s with a bursting altitude of 41255m according to my model. That should be achieved with 0.32kg of helium. That for the filling purposes means 1.997kg of total lift, 0.237kg of free lift and the main figure 0.397kg of neck lift. Meaning that when the balloon starts to hover with a weight of 0.397kg during the filling, I have achieved the desired lift.
At this point, I'd like to writeup a provisional checklist of things that remain to be done some month and half to the launch.
- I want to ideally write a code to pull data from the FLIGHTRADAR24's history, so I can make a visualization of air traffic and the balloon's trajectory for Google Earth.
- I have to get hold of a car charger for ASUS EEE so I don't run out of a battery again.
- I should write some contact info on the payload if somebody finds it ahead of me, or it gets lost.
- I should try edit the videos from the Mobius cam so I can choose the best format to record in.
- I could prepare most of the equipment and put it in a box so I don't have to look for everything at the last moment.
- Check the air traffic for the expected flight time and duration. Just for information, what to expect.
- I have to prepare and weigh the helium filling tube and attach the correct weight to achieve the intended neck lift.
- When the launch day comes, mark several potential landing sites into the maps. A few variations in burst altitude and ascent speed.
- And eventually filling the flight documents at Habitat to get the balloon on the map.
For those interested in the ATmega code, here it is
TT7-40_1_071.ino
UPDATE 06/20/2015
About a month has past since I wrote the original article. In that time I managed to finish the application to download both current and historical data from FlightRadar24. The code is written in Python 3.4 and is for download here
https://github.com/TomasTT7/FlightRadarKML. I also ordered the car charger for Asus EEE from Ebay and made a card with contact information for the payload.
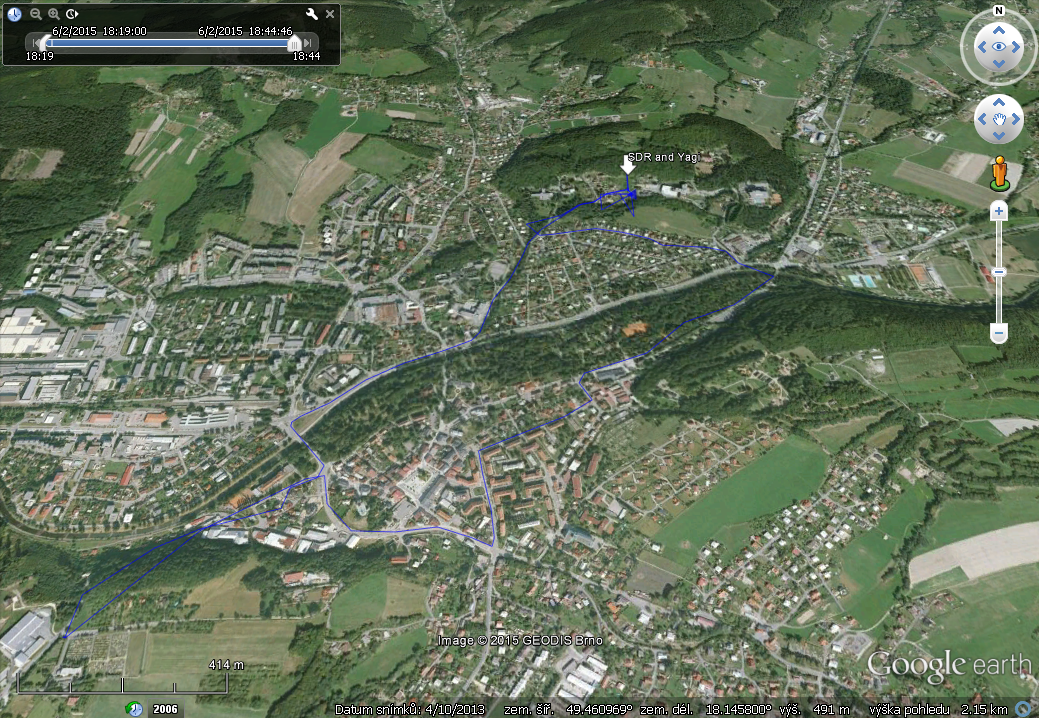
One more test I had forgotten to do earlier was to test the GPS's behavior 'on the move'. So I put the payload inside a car and had the driver to drive around the town while I was tracking it from a smaller hill.
The reception was a little rough at times due to the non-line of sight link between the transmitter and the receiver, but in the end the final data was solid. A little filtered and adjusted trajectory can be seen in this Google Earth animation
TT7-40 GPS test.
I also decided to replace the strings used to suspend the payload for a lighter ones saving about 10g of weight totaling at initially intended 150g payload weight.
For this HAB, since I want to be quite precise with the ascent rate, I decided to replace my old filling system for a lighter one. The previous one used a quite heavy and rigid hose which made it problematic to weigh the balloon's lift precisely. This one should be a lesser influence when attached to the cylinder.
I also had planned to do one more freezer test of the complete payload. Ahead of it, I had to re-do the electrical tape insulation on the RFM22B because it had started to get unstuck, and I re-soldered the battery wires because they tend to get bent and I wouldn't want them to break at the wrong time.
The whole test went fine. The 2400mAh LiPol battery managed to power the camera for 5 hours before dying while taking 35GB of video and the tracker worked fine as well. The temperature on the RFM22B chip stabilized at about -1°C.
Concerning the expected trajectory, I intend to model a whole set with different parameters to have an idea of where to anticipate the landing site to be if the balloon decides to burst earlier, or I screw up the He volume when filling. Here is an example for 06/21/2015 using 20K, 30K, 35K, 38K, 41K burst altitudes, 3 and 4m/s ascent rates, and 5 and 15m/s descent rates.
Hopefully, I'll have to focus only on these and have the rest just in case. It would be great to actually see the payload land.
I also checked the flight schedule of the closest airport. The planes that arrive or depart to and from the airport tend to fly around the launch site at about 3km in altitude. However, the schedule tends to be quite vacant. I used my FlightRadar app to create 6 hour animations of air traffic for everyday in the week as well. It seemed like Fridays get a little busier, but other than that the frequency of airplanes flying by seems to be quite similar.

And that's about it. The atmospheric conditions are inevitably closing on the levels I have been awaiting. Here is a record of 10hPa soundings at 0:00, 6:00 and 12:00 hours in the past 14 days. The blue line shows rising pressure while the red slightly rising temperatures. Ideally, I'd like to wait for a dip in temperature while the pressure stays high. Pressure-wise it seems launching towards 12:00 might be favorable. Temperature-wise I see no trend that would favour any specific time of day. I expect to launch at some point in the upcoming couple of weeks.