Last
time I made superpressure balloons, I used a cheap pump, a pressure sensor and an Arduino hastily put together to test and pre-stretch the newly made balloon envelopes. This time, I thought I would improve upon the setup and make it a bit more solid. The following paragraphs shortly document the result.
These are a couple of images of the finished rig. The purpose of the device is to pressurize an attached balloon in a controlled manner. To achieve this, the rig is equipped with two parallel pumps and a differential pressure sensor. This feedback loop allows either running an automatic pressurizing program, or manually controlling the pumps' output, the target pressure levels, and the rate of pressure increase. In another mode of operation, the rig can measure the amount of air flow and as a result the balloon's inner volume.
The pumps used in the setup are labeled as Mitsumi R-14 A221 found on Ebay. They can pump about 2 liters of air per minute each when running at the top of their voltage range - 7V. Their consumption at that rate is about 230mA per pump. I decided to use two in parallel, because a single pump had trouble maintaining higher pressure levels, due to its leakage, inside the larger balloons last time.
Something that wasn't present in my previous setup is these two flow meters. The YF-S402 water flow meter uses a Hall effect sensor to register revolutions of a turbine blade - a teardown can be found in this
video - and outputs a digital signal. Specifically, a square wave whose frequency corresponds to the flow rate. The meter is intended for water, however once the airflow is sufficient, it works fine with air as well. The second, analog, meter was necessary for initial calibration of the digital output. It can be found on Ebay in a number of versions.
I also added a solenoid valve which can be forced open to depressurize the balloon by delivering 5 to 6 volts to its terminals. The consumption in the open state is about 190mA, hence its operation is managed via an Arduino pin controlled NPN transistor.
The pressure inside the balloon is measured with the help of MPS20N0040D-D a differential pressure sensor whose output is amplified and sampled by an HX711 module - a 24-bit analog-to-digital converter. The datasheet states a 40kPa range for the sensor, however doesn't specify whether that is +-40kPa or +-20kPa. Either way, the expected pressure levels during envelope stretching are well within the range. A digital thermometer DS18B20 was also added to the board to provide means of temperature compensation for the pressure sensor.


At the heart of the controller board is an Arduino ProMini. It provides a simple control interface via an OLED display and three push-buttons. The board and all individual parts aside from the pumps run at 5V provided by an external LDO. The pumps and the LDO are supplied from a 7.5V wall adapter. A PWM signal from the Arduino controls the pumps' operation via an N-channel MOSFET. An SPP-C Bluetooth 2.1 module can be utilized for current data collection (pressure, temperature, run time, airflow rate, and total air volume).

This is a schematic of how the individual parts were wired. The Arduino is supplied through its VCC pin bypassing the onboard regulator. Both transistors are protected by Schottky flyback diodes. The signal to the Bluetooth module's RX pin is brought down to 3.3V via a voltage divider to make it within tolerance of the onboard chip. The DS18B20 is operated in an external power supply mode and the data line is pulled up to VCC. The N-channel MOSFET driving the pumps was chosen to have a 0.5Ω drain to source on resistance to drop the supply voltage to within the pumps' tolerance of 7V. Both transistors have a current limiting resistor on their base/gate. On top of that, the MOSFET's gate is pulled down to GND to ensure the transistor switches off when the Arduino pin goes LOW.

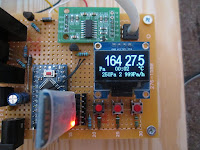
The initial screen allows scrolling through and selecting from a few options. The first option 'Program' launches one out of four predefined automatic programs. The image on the right shows the active program screen. The current pressure reading in top left, current temperature in top right, elapsed time since the start of the program in the middle, current target pressure level in bottom left, current pressure increase rate in bottom right, and information about which program is running in the middle. The middle push-button allows pausing/unpausing the current program, while the right push-button exits the program and returns back to the initial menu. A program constitutes an array of pairs of values which represent a target pressure level and a rate at which the level should be achieved. The array can contain several such pairs to schedule the envelope stretching as desired.


The 'Pressure', 'Rate' and 'Valve' options all have the same screen (image on the left), but each allow setting a different variable with the push-buttons for manual control of the desired pressure levels, pressure increase rates, and the solenoid valve's open/closed state. The image on the right shows a screen of the last option selectable in the initial screen - 'Volume'. In this mode, the left and middle push-buttons provide direct control over the PWM output to the MOSFET and consequently over the voltage across the pumps. The current voltage is shown in the top left corner of the screen. The value is a result of a linear equation derived from actual measurements of the voltage versus PWM output. There isn't any real-time onboard measurement of that voltage. Below that, the screen shows the current airflow rate as measured by the YF-S402. The elapsed time and current temperature follow below. The resulting total volume of air then is shown in the right top corner, while the current pressure is in the bottom right corner.

Since the HX711, being an ADC, output only numerical values between 0 and 2^24, the numbers had to be related to actual pressure values first. Like the first time, I used BMP280, an absolute barometric pressure sensor, and pressurized a test balloon with both sensors inside. This provided me with actual pressure values and specific ADC values related to those pressure levels. First a zero offset of
-1290000 raw ADC count was derived from the data and then a scaling factor of
727 [count/Pa]. The following equation yields the pressure value in Pascal.$$P=\frac{ADC_{count}-1290000.0}{727.0}$$As mentioned previously, the pressure sensor is sensitive to changes in ambient temperature. After collecting data from a colder and a warmer environment, the following equation was derived to compensate the raw ADC count for environmental temperature variations as measured by the DS18B20 thermometer.$$ADC_{count\;offset}=-12900.0\;(20.0-T_{DS18B20})$$Once the electronics achieve stable temperature after power-up, the compensation keeps the pressure reading typically +-15Pa around a 20°C pressure measurement when operating in a 15°C to 29°C ambient temperature range.
Another source of error in the pressure measurements comes from the pumps. Depending on the voltage across the pump terminals, there is an additional positive offset in measured pressure as the airflow increases. A series of measurements led to a lookup table of corrective offsets corresponding to specific pump output levels. A finer resolution in these offsets is achieved by interpolation in the running code.
Similarly, since the flow meter was built for water flow measurement, it was necessary to relate its digital output to the actual amount of airflow. As the meter outputs a square wave signal, the Arduino measures the duration of a single pulse to infer the frequency. The YF-S402's datasheet provides a divisor for the frequency which then yields the final flow rate in liters per minute. This divisor is different, however, for when air is forced through the meter. Again, a series of observations was undertaken to relate flow rate read on the analog airflow meter to specific pump outputs (PWM settings). A divisor of
21.1 was eventually arrived at which provided the most accuracy at maximum pump output.
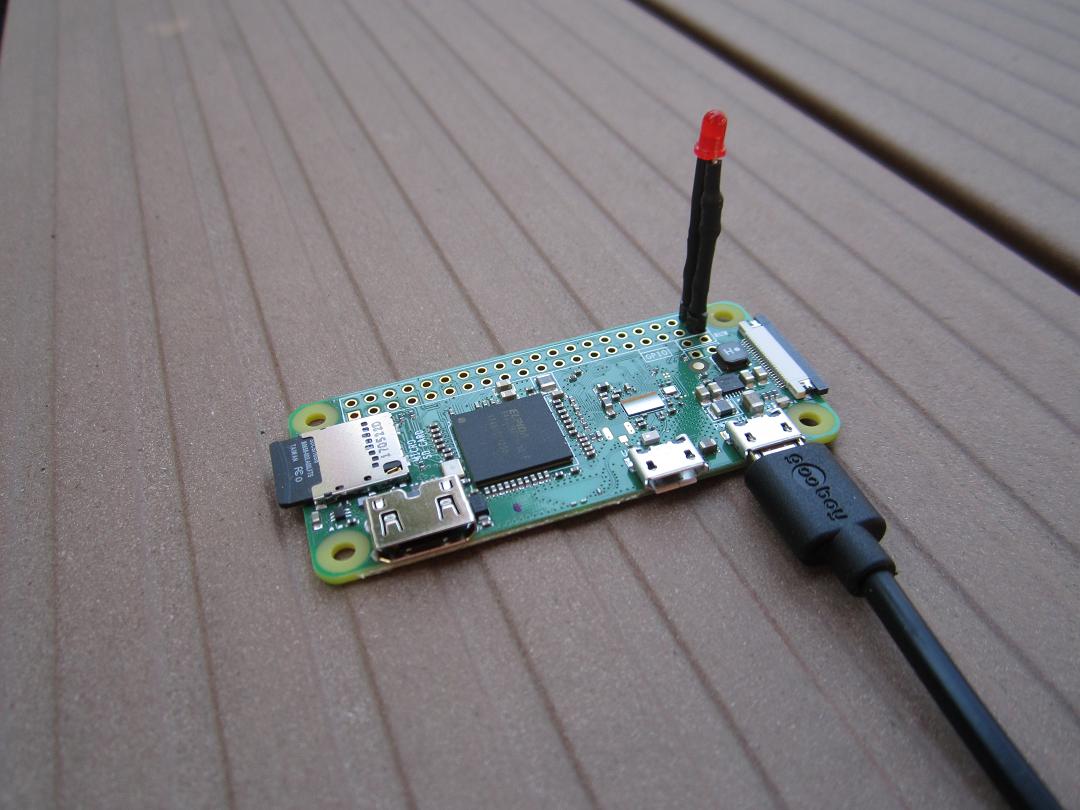
The Bluetooth module, when paired and connected to a master device, transmits periodic updates on current sensory data. Since a pre-stretching program is expected to take 10s of hours, I decided to relay the data collection to a Raspberry Pi Zero W in a similar fashion to the
APRS iGate from an earlier post. The Zero W, having an in-built Bluetooth interface, had to be setup for the reception first.
sudo bluetoothctl
This command, provided the bluetoothctl service has been started which it on Raspbian Stretch (November 13, 2018) by default was, lists the MAC addresses of the device itself and other devices already paired with the module. It also starts its own command prompt.
agent on
default-agent
scan on
Inside the prompt, these commands turn on a Bluetooth agent and start scanning for nearby Bluetooth devices listing their MAC addresses.
pair C2:2C:10:05:8A:4F
trust C2:2C:10:05:8A:4F
After learning the MAC address, these two commands then pair the device to the module, and make the device trusted.
info C2:2C:10:05:8A:4F
Details of a specific device, including its current Paired/Trusted/Connected states, can be displayed by typing the above command.
sudo nano /etc/systemd/system/dbus-org.bluez.service
Following the advice of a few online tutorials and discussion forums, I created a serial port profile by adding a compatibility flag
-C at the end of
ExecStart=/usr/lib/bluetooth/bluetoothd line and inserting
ExecStartPost=/usr/bin/sdptool add SP just below that line inside the above service.
At this point it was possible to connect the Bluetooth device and stream the periodic data from the rig. To finish the objective, I wrote a simple Python
script and created a service to run it.
sudo nano /etc/systemd/system/btpump.service
The content of the service file is on the following lines.
[Unit]
Description=Bluetooth_Pump
After=multi-user.target

[Service]
Type=simple
ExecStart=/usr/bin/python /home/pizero1/btpump.py
Restart=on-abort

[Install]
WantedBy=multi-user.target
If desiring to launch the service without reboot, the systemctl daemon has to be reloaded.
sudo systemctl daemon-reload
Then the service has to be enabled..
sudo systemctl enable btpump
.. and started.
sudo systemctl start btpump
Since the Python script expects the Bluetooth device to be there, I enable and start the service manually in the beginning and then manually stop it and disable before shutting the Pi down again.
In action, stretching a test balloon. In this case, the rig ran a program that slowly increased the inside pressure to 7kPa over the course of 10 hours. In a previous test, the inner volume of the test balloon was measured to be around 12 liters.
The firmware for the controller can be found on
github.


Hi Tomas,
ReplyDeleteA quick question, where did you get the plastic motor mounts? I have been searching in google to no avail but just wonder whether I am using the wrong search term? Thanks
Hi Richard,
Deletethese are just pipe clamps that the pumps happen to fit. I imagine any plumbing supply store should have these or some variant of them on offer.
Tomas
Ha - sorry, I didn't work that out. Good lateral thinking!
DeleteDear Tomas, thank you for publishing this project.
DeleteI have rebuils it but some probs. The punp is not stoppinbg or going slow when target pressure is reached. any suggenstions? i have used a 16Mhz Version of the Atmel - maybe thats the issue? Regards Dan!