
Time: 6:30 GMT (8:30 CEST)
Place: Roznov pod Radhostem, CZ
Live Tracking: https://tracker.habhub.org, https://aprs.fi and ssdv.habhub.org
RTTY
Callsign: TT7F5
Frequency: 434.429MHz
Params: 300 baud, 850Hz shift, 8n2
Preceded by: 5 slow blips (~6s)
Packet: callsign, count, time, date, latitude, longitude, altitude, sats, Vsolar, Vbatt, Tmcu, Ttx,Images,SSDVstatus
Example: $$TT7F5,13,21:13:27,20170629,49.46872,18.15082,395,6,781,3931,21,14,0,S*1F42
SSDV
Callsign: TT7F5
Frequency: 434.429MHz
Params: 300 baud, 850Hz shift, 8n2
Interleaving: RTTY telemetry and APRS packet after every 5 SSDV packets (~1min)
Preceded by: every 5 packet block preceded by 5 fast blips (~2.5s)
Image: 320x240, 50 quality, YCbCr422
APRS
Callsign: OK7DMT-10
Frequency: Geofenced local APRS frequencies
Packet: Base-91 position and telemetry, Backlogged position and telemetry in Comment section
Example: !/5KyHS)='OJ5W 1F94!5MI,S(LWHC!+=7+;0c!'|!4!-<x+S1%!(!$|
Initial Prediction: 2017-09-27


If the voltage on the supercapacitor is higher than 2.5V, the tracker transmits APRS once per minute, RTTY once per two minutes and SSDV at every top of the hour and on every half hour. During the SSDV transmission, the tracker interrupts the packet flow with an interleaved APRS and RTTY transmission after every five SSDV packets (~once per minute). If the supercapacitor voltage is below the 2.5V limit, the tracker transmits only APRS packets once per two minutes and doesn't take images. If the voltage falls below the 2.5V during an SSDV transmission, the tracker first finishes transmitting the whole image before it transitions to the longer, APRS only cycle.

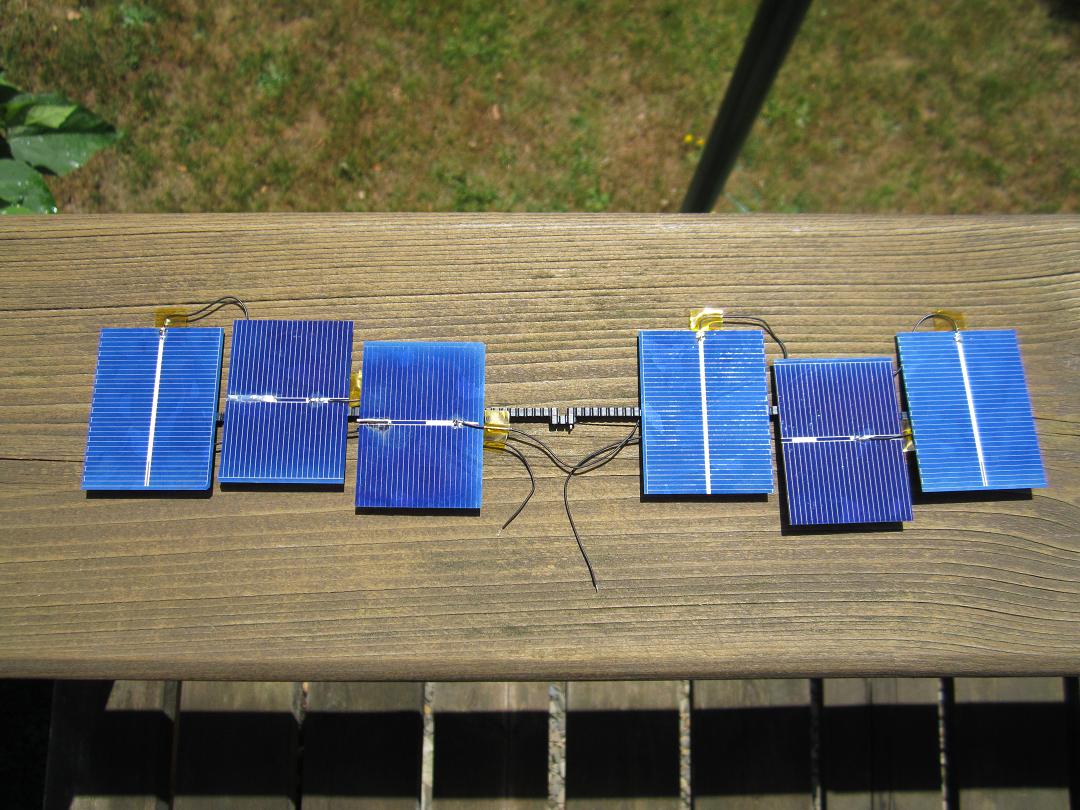


I had to repair the first solar panel that consisted of six 52x39mm solar cells in series at 0° angle to ground, because it output only about 15% of expected power when tested. I found out that it was caused by three cells that significantly underperformed. Working with solar cells was one of the more frustrating parts of the project. Eventually, I arrived at the following method: First, I measure all the cells to be used with a multimeter to ensure they output expected amount of current when illuminated. I then tap a small spot (on the white stripes) I want to solder to with a flux pen. For soldering, I use a hoof tip with the iron set to about 250°C. I load the flat surface of the tip with solder and apply it for a few seconds to the end of the wire laid on the cell. During that, I try to smear it a little to ensure the tip heats both the wire and the cell. After that I tape over the joints on the bottom of the cell with Kapton tape and at least fix the wires that are soldered to the top of the cell in place. When putting the whole panel together I try taping everything in place so it eases off any bending or pulling on the solder joints. I stopped doing the surface scratching I had mentioned in previous blogs, because with this approach it turned out to be unnecessary. Also since I hadn't measured the cells before scratching, I can't be sure it wasn't the cause of the failure in some of the cases. Six solar cells in series required higher value MPPC resistor for LTC3105. Ideally, I would have used 270kΩ, but I didn't have any at the time, so I used 220kΩ instead. The LTC3105's output was set to 2.7V for two parallelly connected 40F supercapacitors. The layout had to be a little unorthodox to keep the pair from entering the image and off the antenna. Speaking of which, a 2-meter dipole was chosen again (492mm for each of the elements). Improvement is expected in image quality, because TT7F5 uses the original camera that doesn't exhibit the annoying colour shenanigans. I should also mention that all the boards saw a slight decrease in consumption after the programming piece of board was cut off. This, as anticipated, had to do with the LDO no longer leaking current when its Vin was less than its Vout.
Mass: 35.4g

The main function running the tracker can be found in ARM_TT7F5.c on GitHub. The code is basically identical to TT7F2's. There are only hardware specific modifications such as different PLL settings since F5 has 16MHz crystal oscillator while F2 had just 12MHz one. An illustration of the tracker's operation as recorded in APRS packets can be seen in the chart above. The poorly insolated periods are the result of the tracker being placed indoors waiting for thunderstorms to blow over.


After looking at the performance of the previous four balloons and comparing the Gamma estimates to values derived from the actual float altitudes, it was apparent the estimates were way off. I also had reoccurring problems properly sealing the bigger 1.84m balloons, so eventually I decided to try something new. The balloon was made from the same 50 micron PE/PA/EVOH/PA/PE material, but this time to a shape of a tube/cylinder when inflated. The flat form is 3.35m in length and 1.35m in width. The stretching rate along the cylindrical circumference rapidly increased at around 1.3-1.4kPa some 12 hours into the process after which I turned the pump off and just logged the data for further 10 hours. The other reason to stop pressurizing was an occurrence of small defects in the film that historically led to envelope failures when stretched further. I am not certain about the origin of these. Could be a consequence of inept transportation, my careless handling, or an inherent deficiency of the material. Either way, it meant stopping at estimated 1.35 Gamma. The approximated original volume was 1.484m3, now expanded to 2m3 level. Some time spent modelling in my Jupyter notebook led me to try for slower ascent rate minimizing the amount of hydrogen inside the envelope. The following estimates will hopefully be a better match than the previous bunch.
Expected Float Altitude: 13400m
Expected Ascent Rate: 0.75m/s
Expected Superpressure: 1584Pa (at 17°C supertemperature)
Gas: Hydrogen
Free Lift: 11g


This launch was preceded by several weeks of poor weather and unsteady predictions. Even the actual launch time was predicted to be clear skied just hours prior to it. I managed to fill the balloon to the desired free lift almost spot on (104.14g weight - 35.4g payload - 11g free lift = 57.74g). Though due to its length it had to be folded a little to fit inside the garage. Once again I set up an improvised mast for a simple 434MHz ground plane antenna with an LNA. All that leading to an RTL-SDR v3 via 5m of coaxial cable. The balloon went straight up without menacing any of the many trees around. The main issue came right after it peaked above the cloud layer as first confirmed by soaring solar panel voltage and later by the SSDV images. The conditions right above the clouds deprived the balloon of the little free lift it had and locked it in a horizontal flight at around 2800m in altitude for the following two hours or so. Eventually, it found its way to the edge of the continuous cloud cover and started ascending again. At 12.2km it settled to float for the rest of the day. Thanks to receivers in Slovakia (OM1ATS, OM5KV-1) and Poland (SQ9CWT) a number of complete SSDV images was collected throughout the first day.
Data
APRSfi_TT7F5.txt - collected raw packets.
Python parser of APRS.fi raw packet format.
Received SSDV images:
Day 1


