| No. | Type | Size | Marking | Date | Note |
|---|---|---|---|---|---|
| 1 | Sphere | 1.33 | first | April | TT7F1 |
| 2 | Sphere | 1.84 | first | April | TT7F3 |
| 3 | Sphere | 1.33 | second | April | hole in stretched area |
| 4 | Sphere | 2.66 | first | April | meridional weld opening (repeatedly) |
| 5 | Sphere | 1.33 | n1 | July | hole in stretched area |
| 6 | Sphere | 1.33 | n2 | July | hole in stretched area |
| 7 | Sphere | 1.33 | n3 | July | TT7F2 |
| 8 | Sphere | 1.84 | n1 | August | hole at the edge of repaired meridional weld |
| 9 | Sphere | 1.84 | n2 | August | TT7F4 |
| 10 | Sphere | 1.84 | n3 | August | hole at the edge of repaired filling tube weld |
| 11 | Sphere | 2.66 | n1 | August | hole in meridional weld opening |
| 12 | Sphere | 1.84 | n4 | August | unintentionally sealed filling tube |
| 13 | Sphere | 1.84 | n5 | August | circumferential weld opening (repeatedly) |
| 14 | Sphere | 1.84 | n6 | August | meridional weld opening (new heat element wire) |
| 15 | Sphere | 1.84 | n7 | August | hole in meridional weld opening |
| 16 | Sphere | 1.33 | n4 | August | hole in stretched area |
| 17 | Tube | 3.33 | n1 | September | TT7F5 |
| 18 | Tube | 2.33 | n1 | September | TT7F6W |
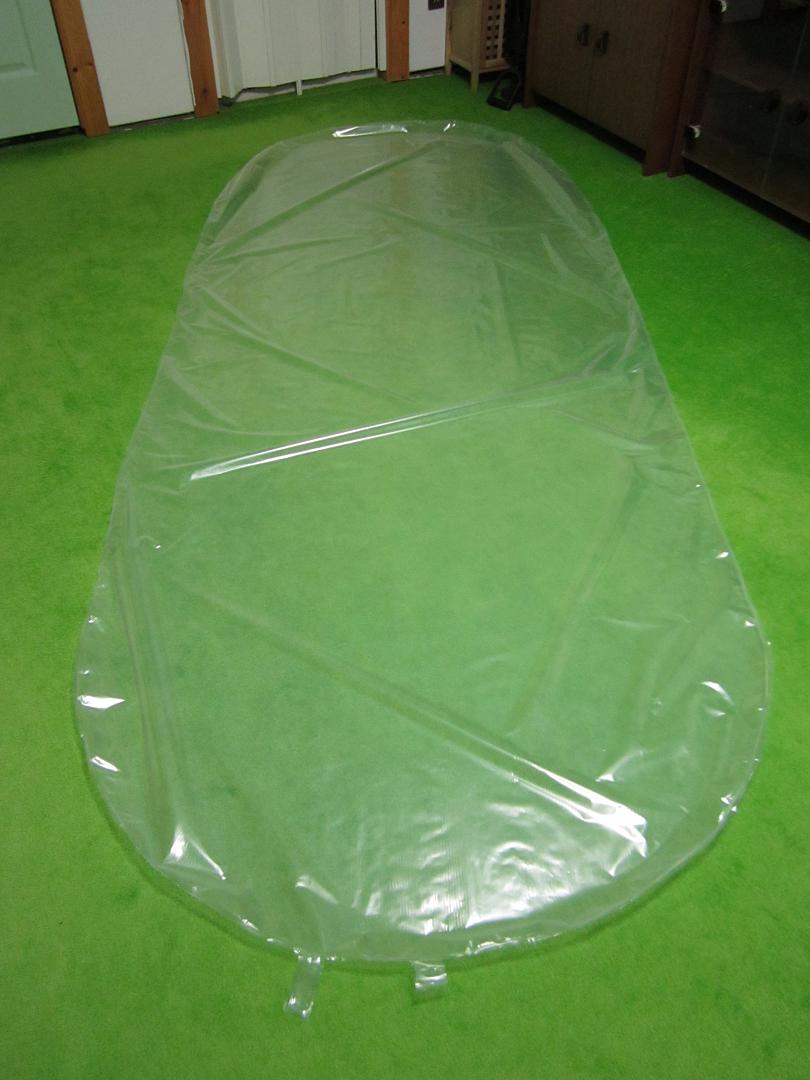
The table above, summarizing all the balloons I had to make, suggests it wasn't as straightforward as I would like. I encountered a number of issues a portion of which originated in the need to redo some of the welds after they had opened during initial stretching. Another portion due to weak spots in the material itself. Usually, the failures of the smaller envelopes were the second type showing itself as small breaches in some layer(s) of the film that with further stretching eventually burst. I am not sure about the origin of these seemingly randomly appearing spots, but they do limit the extent to which the stretching can proceed. The larger envelopes, made of more individual pieces, mostly suffered from weld openings. Particularly problematic was the meridional weld which is located in the area of the highest stress. In S1.84_n3 and S1.84_n4, I tried to get round this issue with a different construction method which saw the meridional weld replaced by two shorter welds further from the main stress area. However, the result was the same. At one point, I started to notice an inability of the heat sealer to produce reliable welds. Over the course of several envelopes, I attempted to repeatedly repair the connections between the heat element wire and the rest of the circuit, and periodically check the weld quality with test stripes that I could stretch and examine. None of this, though, brought success. I also contemplated following the example of others and make my own heat sealer for a while, but in the end being pursued by the intended launch dates, I decided to stick to the current device. I did, however, buy a new heat element wire which significantly improved the weld quality. I still failed with a few more spherical envelopes, but eventually after trying a different shape (tube balloon), I finally worked my way to promising results again.


| Flight | Type | kg | m3 | Γ | m3 |
|---|---|---|---|---|---|
| TT7F1 | S1.33 | 0.136 | 0.358 | 1.94 | 0.695 |
| TT7F2 | S1.33 | 0.136 | 0.358 | 1.93 | 0.691 |
| TT7F3 | S1.84 | 0.260 | 0.949 | 1.83 | 1.737 |
| TT7F4 | S1.84 | 0.260 | 0.949 | 1.74 | 1.651 |
| TT7F5 | T3.33 | 0.395 | 1.484 | 1.35 | 2.003 |
| TT7F6 | T2.33 | 0.265 | 0.921 | 1.51 | 1.391 |
I should also reflect on the volume and mass estimates of individual envelopes I have made. The table above shows the estimated mass and volume of the individual envelopes used on specific flights followed by the estimated Gamma and final volume estimate after stretching. Starting with the spherical (Mylar balloon shaped) balloons, throughout manufacture and stretching I used the equation provided by Wikipedia: $$V = \frac{2}{3} \pi a r^2$$ to calculate the volume estimate. Where $a$ is one fourth of the meridional circumference (radius of deflated envelope) and $r = 0.763 a$ (radius of inflated envelope). Throughout stretching, I periodically measured the meridional circumference and recalculated the volume. To calculate the mass estimate: $$m = 2\frac{\pi d^2}{4} \cdot t \cdot \rho$$ where the first part of the equation corresponds to the area of the two flat sheets of film which is then multiplied by the material thickness $t$ and density $\rho$. Having that many failed envelopes, I eventually used them to measure the mass directly, and found that the real mass differed by a factor of 1.079-1.089 to the calculated estimates. Following with the tube balloon estimates, I used: $$V= \frac{2}{3} \pi a r_{1}^2 + \pi r_{2}^2 l$$ to calculate the volume. It is basically an S1.33 Mylar shape balloon split by a cylinder of length $l$. The radius $r_{1}$ relates to the Mylar shape balloon while $r_{2}$ is the cylinder's radius of circumference $4a$ thus $r_{2} = 4a / \pi / 2$. During the stretching process, I measured the circumference in two different places, because the balloon expanded unevenly. To reflect that, I calculated the average circumference $(c_{mid} + c_{edge}) / 2$ and used it instead. For the mass estimate: $$m =(2\frac{\pi d^2}{4} + 2 d l) \cdot t \cdot \rho$$ where $2dl$ corresponds to the area of the cylindrical section. In case of the tube envelopes, I didn't have any failed ones and didn't want to fold the flight ready envelopes to fit it on a scale, so I simply adjusted the estimates by the previously derived factor of 1.08, and used these values in the consequent lift calculations.


| Flight | Type | kg (b) | kg (p) | kg (fl) | kg (h) | m | Pa | °C | m3 | % |
|---|---|---|---|---|---|---|---|---|---|---|
| TT7F1 | S1.33 | 0.148 | 0.0134 | 0.0112 | 0.0129 | 11242 | 23285 | -51.6 | 0.476 | 68.5 |
| TT7F2 | S1.33 | 0.148 | 0.0197 | 0.0108 | 0.0134 | 10524 | 25900 | -46.4 | 0.455 | 65.8 |
| TT7F3 | S1.84 | 0.283 | 0.0319 | 0.0156 | 0.0247 | 13403 | 16573 | -62.7 | 1.237 | 71.2 |
| TT7F4 | S1.84 | 0.283 | 0.0315 | 0.0183 | 0.0249 | 11864 | 20341 | -56.4 | 1.038 | 62.8 |
| TT7F5 | T3.33 | 0.427 | 0.0354 | 0.0110 | 0.0354 | 12226 | 18782 | -57.4 | 1.641 | 81.9 |
| TT7F6 | T2.33 | 0.287 | 0.0210 | 0.0073 | 0.0236 | 12153 | 20342 | -61.8 | 0.988 | 71.1 |
This table sums up the actual masses of the envelopes (b) and payloads (p), the actual amounts of free lift (fl) to which I managed to fill the balloons, the corresponding amount of hydrogen (h), the actual float altitudes, and back calculated values of the envelope volumes. Following the volume figure is a column comparing the back calculated value to the original estimate. For the calculation itself, I interpolated pressure and temperature values corresponding to the float altitude from the closest atmospheric sounding data. $$V = \frac{m_b + m_p + m_g}{p_{air} / R_{air} / T_{air}}$$ The equation is a specific form of the ideal gas law. Since at float altitude, the density of the system is in equilibrium with the density of the surrounding air, the volume of the system (majority of which is the balloon) equals to the mass of the whole system (balloon, payload and gas) divided by the air density. $R_{air}=286.9 \, J/kgK$ is the specific gas constant of air and $T_{air}$ is in Kelvin. In case of TT7F4, the values relate to the altitude at which the balloon burst.


Generally, I filled the balloons the evening prior to launch and left them in the garage overnight. In all cases, I found the lift to be 1-2g higher the next morning. The only explanation I could come up with was IR absorption that must have increased the gas temperature with respect to the surrounding air.
A curious situation came about at the launch of TT7F6W. The outside temperature was several degrees lower to the previous launches, and the sun rays didn't reach the garden for much longer as well. So it happened that the balloon standing in shade for about 45 minutes had lost almost all lift by the time I was ready to launch. Placing it in the sun saw the lift restore itself eventually and be ready for an attempt number two. A quick calculation suggests that the gas must have cooled down to be at least 7°C lower than the temperature of the surrounding air.
At the start of this section, there are two charts depicting ascent rates of all six flights up to their float altitudes. TT7F1 and F2 are recorded only to 4000m and 8000m respectively due to software/hardware issues. The data represent a 10 set average of data points mostly 1-2 minutes apart to smooth the curves somewhat. A quick look at the initial stages of individual flights suggests that the calculations outlined previously did a good enough job in sizing the lift. Worth noticing is the gradual increase in ascent rate peaking at around 10500m in case of the tube balloons. Their more aerodynamic shape causes less drag compared to the more spherical balloons allowing them to pick up speed. Another interesting curve is TT7F5's which recorded a two stage ascent forced by a layer of low clouds that held the balloon for more than two hours.
| Flight | Days | Great Circle | Distance | Failure |
|---|---|---|---|---|
| TT7F1 | 8.63 | 8003km | 9465km | indeterminable |
| TT7F2 | 2.08 | 2032km | 3326km | failed transmitter |
| TT7F3 | 0.50 | 238km | 275km | indeterminable |
| TT7F4 | 0.16 | 203km | 210km | failed envelope during ascent |
| TT7F5 | 1.42 | 1111km | 1189km | indeterminable |
| TT7F6 | 2.88 | 3230km | 3898km | indeterminable |
The table above provides a quick summary of the individual flights in terms of duration from the first received packet to the last, and in terms of the total distance between successive packets that were received. Great circle distance then represents the distance between the first and the last point on the surface of a sphere.
TT7F1 - the first and also the longest flight delivered its last packet over Japan right before it set off to cross the Pacific. It never arrived to Alaska where it was supposed to show up two and half days later. The float altitude was 500m lower (10588m) from the previous day on the last day packets were received. I didn't log the state of weather (storms, high clouds) over the Pacific at that time. A 400m wobbling in altitude was recorded at sunset of the third day.
TT7F2 - the tracker wrestled with a poor connection between the transmitter and the MCU since day one delivering the last packets on the third day over southwestern Russia. During that time, the float altitude moved between 10234m and 10524m which seems to comply with the natural range of fluctuation of a concrete pressure level within the atmosphere. I didn't log the weather conditions either.
TT7F3 - achieved the highest float altitude - 13403m. It experienced wild wobbling at sunset of the first day over Hungary. First 1100m drop in altitude followed by 800m rise and another 800m drop inside 45 minutes. It wasn't heard of the next day, nor the days after. The weather along its predicted path was clear skied and stormless.
TT7F4 - experienced an apparent envelope failure at 11864m. It was filled to a higher free lift than the previous balloon. It was also one of the latter spherical envelopes made while the impulse heat sealer was experiencing difficulties with inconsistent welding. After the failure, the balloon descended at a rate of initially -4m/s to -2m/s in the later stages. It eventually landed at the Polish-Slovak border.
TT7F5 - simply didn't show up on the third morning after two whole days without noticing any problems. The last packet was received from above the Ionian Sea. The balloon was expected to report from above Greece the next morning, but never did. After launch, the balloon was held by a layer of low clouds at about 2800m for two and a half hours before it ascended to its average float altitude of 12170m. There were no storms, nor high clouds on its predicted path.
TT7F6W - similarly to F5, both the balloon and electronics operated without any problems for the first three days. The fourth day, however, saw only one WSPR packet coming through from above Iran exactly where Hysplit had it predicted at that time. Eventually, it turned out to be the last packet, and the tracker wasn't heard of again. Over the course of the three days, the average altitude was slowly decreasing all within the range of natural pressure level fluctuation. The balloon experienced a loss of lift right before the first attempt to launch it. The lift eventually recovered after the balloon was placed in the sun. It was then successfully launched during the second attempt.
Assessing the overall envelope performance has turned out to be problematic since there was only one confirmed and recorded failure (F4). With F1's altitude drop on the last day potentially suggesting another. In case of the F3, F5 and F6 balloons, it is unclear whether their failure originated in the envelope or a broken tracker. There simply weren't any more received packets in the following days. I would think a balloon failure to be more probable during the day, around local noon or afternoon, when the lifting gas reaches the highest temperature hence the most superpressure. With respect to a nighttime failure, I can only think of loosing lift due to the gas cooling down too much with respect to the surrounding air as the possible reason. As mentioned, there were two cases of recorded wobbling in altitude as the sun set which I attribute to the gas rapidly cooling down before finding a nighttime equilibrium again.
Balloon Types Overview
This is a summary of parameters of the individual envelopes I have made. In the cases of balloons that have flown, I mention a volume figure derived from the actual float altitudes. This figure will differ in individual balloons of the same type depending on the achieved amount of stretch.


Theoretical Notes
This section serves to summarize and illustrate some of the factors involved in balloon making, and the implications of different design choices. A superpressure balloon has a specific amount of lifting gas sealed inside an envelope of a specific volume. The initial ascent is due to the lifting gas causing buoyant force in upward direction that is bigger than the weight of the whole system. The amount of 'free lift' decides the ascent rate. As the balloon ascends, the surrounding air pressure decreases allowing the gas to expand decreasing the density of the whole system and keeping it lower than the density of the surrounding air. At some point, the expanding gas fills the whole envelope after which the buoyant force gradually decreases while the balloon still ascends. The floating phase starts when the buoyant force equals the weight of the whole system, in other words the system's density is in equilibrium with the density of the surrounding air. The difference in pressure levels between the point the gas stops expanding and the moment the balloon no longer ascends corresponds to the extent to which the envelope gets pressurized and is referred to as superpressure. On top of that, the envelope is subjected to variations in temperature of the lifting gas with respect to the temperature of the surrounding air. This is referred to as supertemperature and may further add to the pressure inside the envelope. The pressurized vessel is then subjected to stresses inside the envelope material.


| r (m) | V (m3) | t (μm) | p (Pa) | σ (MPa) |
|---|---|---|---|---|
| 0.25 | 0.065 | 50 | 1000 | 2.50 |
| 0.50 | 0.524 | 50 | 1000 | 5.00 |
| 0.75 | 1.767 | 50 | 1000 | 7.50 |
| 1.00 | 4.189 | 50 | 1000 | 10.00 |
The table above shows how the tensile stress in an envelope depends on the radius of the balloon. At the same superpressure, the walls of a larger envelope are subjected to higher stress. This is noticeable particularly during stretching and needs to be taken into account when planning a stretching profile. For example, the smaller S1.33 envelopes were stretched with gauge pressures of up to 2.2-2.3kPa while the larger S1.84 envelopes only up to 1.5-1.7kPa. I also saw weld failures in the largest S2.66 envelopes as early as 400Pa.
| r (m) | V (m3) | mb (kg) | mp (kg) | mg (kg) | v (m/s) | mfl (kg) | alt (m) | sp (Pa) | σ (MPa) |
|---|---|---|---|---|---|---|---|---|---|
| 0.25 | 0.065 | 0.038 | 0.010 | 0.00396 | 1.0 | 0.0046 | 4240 | 5237 | 13.1 |
| 0.50 | 0.524 | 0.153 | 0.010 | 0.01297 | 1.0 | 0.0101 | 11492 | 1201 | 6.0 |
| 0.75 | 1.767 | 0.345 | 0.010 | 0.02780 | 1.0 | 0.0168 | 14288 | 593 | 4.4 |
| 1.00 | 4.189 | 0.613 | 0.010 | 0.04842 | 1.0 | 0.0244 | 16193 | 361 | 3.6 |
On the other hand, lifting the same payload (10g) with the same initial ascent rate (1m/s) with larger envelopes leads to less superpressure inside the balloon and less stress in the material. These calculations assume the temperature of the gas (hydrogen) and ambient air to be the same, and do not account for the effect of supertemperature which depends on altitude (more on that later).
| r (m) | r/r | V (m3) | V/V | m (kg) | m/m | ρ (kg/m3) | ρ/ρ | alt (m) | a/a |
|---|---|---|---|---|---|---|---|---|---|
| 0.25 | 0.065 | 0.038 | 0.5856 | 7059 | |||||
| 0.50 | 2 | 0.524 | 8 | 0.153 | 4 | 0.2928 | 0.5 | 12377 | 1.75 |
| 1.00 | 2 | 4.189 | 8 | 0.613 | 4 | 0.1464 | 0.5 | 16770 | 1.36 |
| 2.00 | 2 | 33.510 | 8 | 2.453 | 4 | 0.0732 | 0.5 | 21139 | 1.26 |
| 4.00 | 2 | 268.083 | 8 | 9.812 | 4 | 0.0366 | 0.5 | 25475 | 1.21 |
| 8.00 | 2 | 2144.661 | 8 | 39.247 | 4 | 0.0183 | 0.5 | 29897 | 1.17 |
This table points out the relationship between the balloon's radius and its float altitude. Using the same material (50μm 976kg/m3 dense PE/PA/EVOH/PA/PE film) and doubling the radius leads to increasing the volume 8 times, increasing the mass 4 times, and consequently more or less halving the system density (mass of the additional gas required offsets this a little). The air pressure, however, decreases much faster with altitude. This puts a practical limit on reaching higher altitudes by increasing the balloon's radius. The density-altitude values are based on the U.S. Standard Atmosphere model.
| material | t (μm) | ρ (kg/m3) | r (m) | V (m3) | mb (kg) | mg (kg) | alt (m) | sp (Pa) | σ (MPa) |
|---|---|---|---|---|---|---|---|---|---|
| S1.84 (TT7F3) | 50 | 976 | 1.237 | 0.283 | 0.02302 | 13241 | 745 | ||
| PE/PA/EVOH/PA/PE | 50 | 976 | 0.666 | 1.237 | 0.272 | 0.02217 | 13485 | 726 | 4.8 |
| PE/PA/EVOH/PA/PE | 40 | 976 | 0.666 | 1.237 | 0.218 | 0.01796 | 14842 | 632 | 5.3 |
| MYLAR | 50 | 1390 | 0.666 | 1.237 | 0.387 | 0.03107 | 11314 | 910 | 6.1 |
| MYLAR | 36 | 1390 | 0.666 | 1.237 | 0.279 | 0.02270 | 13332 | 738 | 6.8 |
| MYLAR | 25.4 | 1390 | 0.666 | 1.237 | 0.197 | 0.01634 | 15449 | 593 | 7.8 |
| MYLAR | 12.7 | 1390 | 0.666 | 1.237 | 0.098 | 0.00868 | 19537 | 389 | 10.2 |
| HEPTAX | 25.4 | 953 | 0.666 | 1.237 | 0.135 | 0.01154 | 17699 | 470 | 6.2 |
In light of this, a more reasonable way to increase altitude is using thinner or less dense materials. The table compares the performance of TT7F3's envelope with seven other idealized spherical balloons made of available materials with different thicknesses and densities. The envelope volume, the payload mass (10g), and the initial ascent rate (1m/s) were set the same in all cases. As is apparent, it is the envelope mass that changes, leads to less required gas, and consequently higher altitudes. The superpressure inside the envelope also decreases, however, since the cross sectional area exposed to the tensile forces shrinks, the stress in the material actually increases.


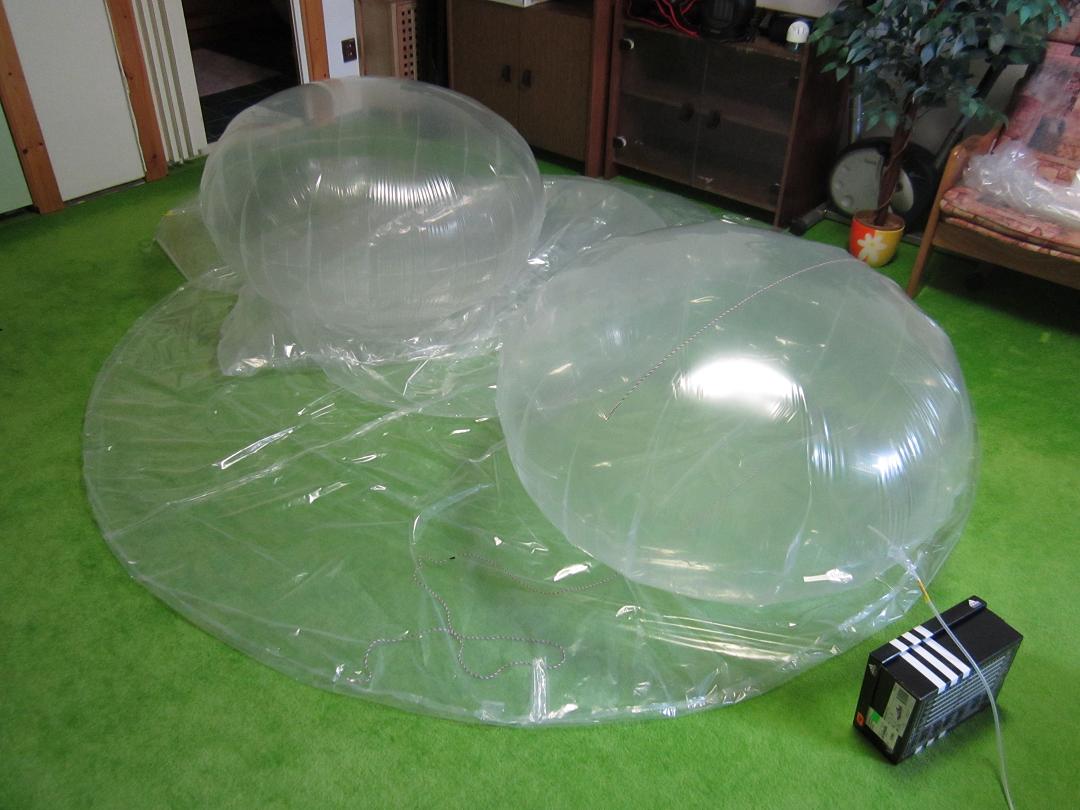
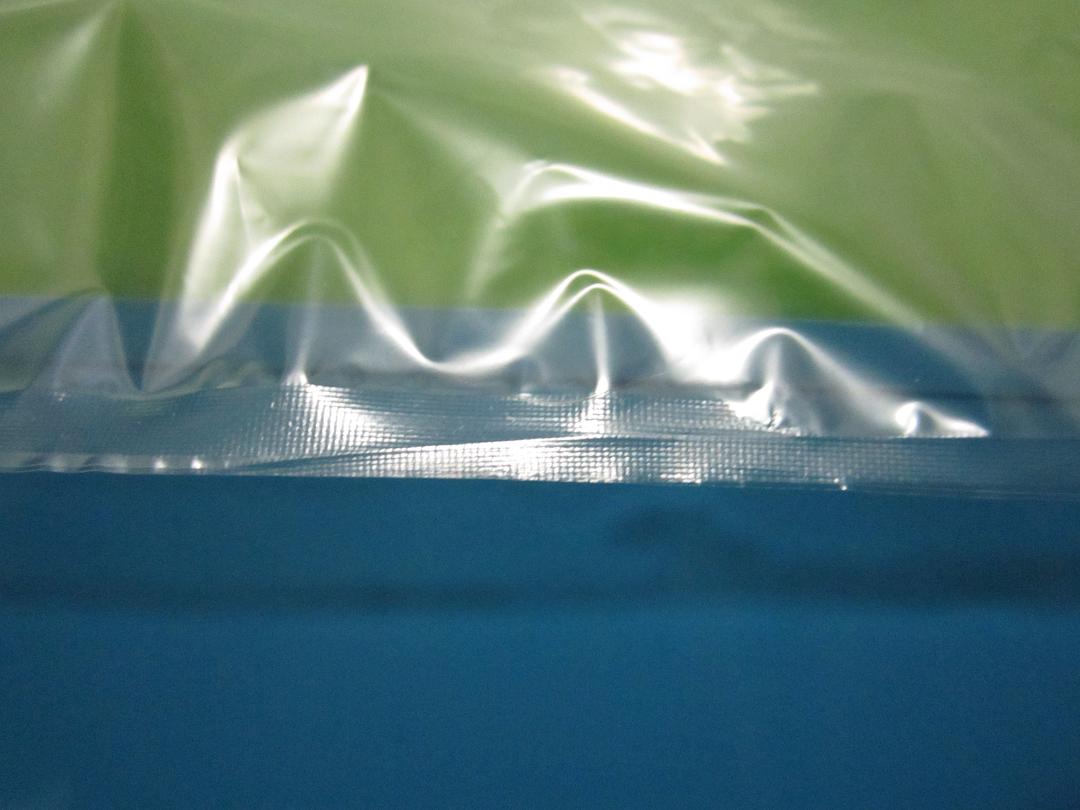
Practically, the weld testing could be done by rapid inflation which has, in terms of the stress-strain curves, the same effect as lowering temperature. In other words, high internal pressure and consequently stress in the material lead to very little elongation and plastic deformation. The stress relieving, on the other hand, requires the material to deform plastically. The envelope is pressurized very slowly at room temperature which means that significant elongation can be achieved at relatively low stresses. The spots with concentrated stress elongate first evening the local stress with the surrounding levels. This is apparent from the shape of the envelope slowly progressing towards an ideal sphere where stress is uniformly distributed along the whole surface. In terms of the welds, the initial wrinkles get slowly smoothed out.
One consequence brought about by stretching is that the material gets thinner. To calculate the negative strain in the z dimension, it is necessary to take into account the stress in x and y directions as in the following equation: $$ \varepsilon_z = - \nu (\sigma_x + \sigma_y) / E$$ still working with idealized spheres in these examples, $\sigma_x$ and $\sigma_y$ are equal, $\nu$ is the Poisson's ratio which for Mylar is 0.38 in the elastic region and 0.58 in the plastic region, and $E$ is the Young's modulus (3447MPa for Mylar). Now, I am not certain whether this equation can be used for calculations in the plastic region as well. Nevertheless, the following example computes $E$ in the plastic region simply as $\sigma / \varepsilon$ for each data point (all values extracted from the 35°C stress-strain curve). Hopefully, it can produce a rough approximation of the effect of stretching without introducing too much error.
| material | r (m) | mb (kg) | mg (kg) | V0 (m3) | t0 (μm) | alt0 (m) | σ0 (MPa) | sp0 (Pa) |
|---|---|---|---|---|---|---|---|---|
| MYLAR | 0.5 | 0.055 | 0.00531 | 0.524 | 12.7 | 17277 | 13.1 | 9876 |
| MYLAR | 0.5 | 0.111 | 0.00966 | 0.524 | 25.4 | 13394 | 9.7 | 19751 |
| MYLAR | 0.5 | 0.157 | 0.01327 | 0.524 | 36 | 11343 | 8.5 | 27994 |
| MYLAR | 0.5 | 0.218 | 0.01801 | 0.524 | 50 | 8926 | 7.9 | 38880 |
| ε1 (%) | V1 (m3) | t1 (μm) | alt1 (m) | σ1 (MPa) | sp1 (Pa) | ε2 (%) | V2 (m3) | t2 (μm) | alt2 (m) | σ2 (MPa) | sp2 (Pa) |
|---|---|---|---|---|---|---|---|---|---|---|---|
| 10 | 0.697 | 11.2 | 19089 | 12.2 | 7936 | 20 | 0.905 | 9.8 | 20729 | 11.7 | 6320 |
| 10 | 0.697 | 22.5 | 15206 | 9.1 | 15873 | 20 | 0.905 | 19.5 | 16861 | 8.8 | 12641 |
| 10 | 0.697 | 31.8 | 13155 | 7.9 | 22497 | 20 | 0.905 | 27.6 | 14810 | 7.7 | 17916 |
| 10 | 0.697 | 44.2 | 11183 | 7.0 | 31245 | 20 | 0.905 | 38.4 | 12838 | 6.8 | 24883 |
Four same size different thickness Mylar balloons in a shape of an ideal sphere were modelled at 0%, 10% and 20% stretch all lifting 10g payloads at 1m/s initial ascent rate. The $\sigma$ parameter represents the stress due to superpressure from the required lifting gas at float altitude while the $sp$ parameter represents the maximum internal pressure the envelope can sustain at -55°C (corresponds to 194.4MPa breaking stress). As the envelope stretches, the float altitude increases and stress in the material due to the lifting gas decreases despite the decreasing wall thickness. However, the maximum sustainable superpressure decreases as well. That is because the envelope's radius increases with the volume which means that the same internal pressure level leads to higher stress. From a practical point of view, it should be noted that stretching Mylar, due to its strength, requires machinery capable of generating and sustaining much higher pressure levels than when stretching the PE/PA/EVOH/PA/PE film.
| balloon | V (m3) | m (kg) | V/m | rs (m) | Vs (m3) | ms (kg) | Vs/ms | V/Vs |
|---|---|---|---|---|---|---|---|---|
| S1.33 (TT7F1) | 0.476 | 0.148 | 3.22 | 0.491 | 0.496 | 0.148 | 3.35 | 96.0% |
| S1.33 (TT7F2) | 0.455 | 0.148 | 3.07 | 0.491 | 0.496 | 0.148 | 3.35 | 91.8% |
| S1.84 (TT7F3) | 1.237 | 0.283 | 4.37 | 0.679 | 1.311 | 0.283 | 4.64 | 94.3% |
| T2.33 (TT7F6) | 0.988 | 0.287 | 3.44 | 0.684 | 1.340 | 0.287 | 4.67 | 73.7% |
| T3.33 (TT7F5) | 1.641 | 0.427 | 3.84 | 0.834 | 2.430 | 0.427 | 5.70 | 67.5% |
A useful way of quickly comparing envelopes of different shapes and materials is their Volume to Mass ratio. The table above provides these ratios for five of the TT7F envelopes. Further, it compares them with ratios of ideal spheres made of the same material of equivalent mass. The last column then shows how close I got to the ideal shape of a sphere with individual envelopes. Ideal in terms of maximizing internal volume per mass of material. A comparison of F3 and F5 illustrates that envelope shape is crucial, and despite weighing 1.5x more, F5 eventually floated 1200m lower than F3 as anticipated by the ratio. The reciprocal of the V/m ratio is basically a density level corresponding to an altitude at which the envelope would float if it could hold the 'inflated' shape with vacuum inside. It can be viewed as an upper limit which the balloon won't surpass.

I used this tool, which provides raw data per wavelength for download, to generate the blackbody radiation curves. Alternatively, the Stefan-Boltzmann law can be used to get the total power radiated by a black body at a specific temperature: $$ P = \varepsilon \sigma A T^4$$ where $P$ is the total power radiated by a black body at temperature $T$ (kelvin), $\varepsilon$ is emissivity in case the body emits less than the idealized black body, $\sigma = 5.67 \times 10^{-8} \: W \cdot m^{-2} \cdot K^{-4}$ is the Stefan-Boltzmann constant, and $A$ is the area of the radiating surface.
| CLEAR DAY | Pt (W/m2) | Pa (W/m2) | absorbed | contribution |
|---|---|---|---|---|
| direct solar | 1366.0 | 307.0 | 22.5% | 44.7% |
| ground reflected solar (4%) | 54.6 | 12.3 | 22.5% | 1.8% |
| ground emitted IR | 240.0 | 171.2 | 71.3% | 24.9% |
| atm. emitted IR - sides (-55°C) | 129.0 | 90.9 | 70.5% | 26.5% |
| atm. emitted IR - above (at 12km) | 20.0 | 14.4 | 72.0% | 2.1% |
| thermal equilibrium | 9.7°C | 2157.8W | 100.0% |
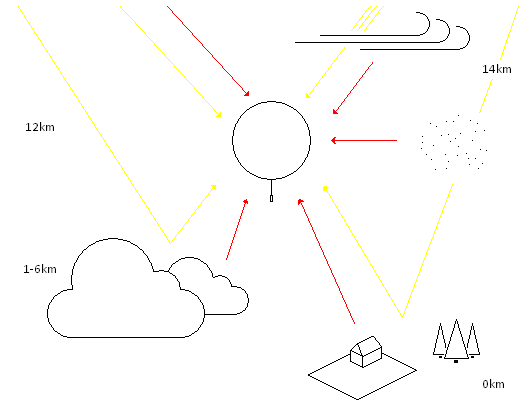
The table above summarizes a potential scenario which a balloon floating at 12km altitude may experience during a cloudless day. The second column contains radiation flux estimates per individual contributor. The actual power absorbed during the three interactions described earlier (outside surface absorption, opposite inner surface absorption and absorption from the second reflection) is in the third column. All values reflect the material's absorptivity at each individual wavelength. $$ P = \Phi_1 \pi r^2 + \Phi_2 \pi r^2 + \Phi_3 \pi r^2 + 2 \Phi_4 \pi r^2 + \Phi_5 \pi r^2$$ The total absorbed power by a balloon with 1 meter radius made of the hypothetical material is 2157.8W. All contributors were multiplied by the balloon's cross-sectional area and summed. Note the larger area in case of the side flux $\Phi_4$. $$ T = \sqrt[\leftroot{1}\uproot{2}\scriptstyle 4]{\frac{P}{\varepsilon \sigma (4 \pi r^2)}} $$ The equation above computes the temperature of the film after the balloon reaches thermal equilibrium. In other words, it reaches a temperature at which it emits as much power as it absorbs. The area, in this case, is the whole surface of the sphere, and $\varepsilon = 0.47$ is an averaged emissivity of the material in infrared. The calculated film temperature due to radiation in this particular scenario rose to 9.7°C with the surrounding air at -55°C. Assuming the gas inside the balloon reaches thermal equilibrium with the film, the envelope is exposed to stresses caused by 64.7°C of supertemperature. In reality, the actual film temperature would be somewhere between this upper limit and the ambient air temperature, because of air conduction and convection taking some of the heat away. These effects, though, seem quite complex to estimate any closer.
| CLEAR NIGHT | Pt (W/m2) | Pa (W/m2) | absorbed | contribution |
|---|---|---|---|---|
| ground emitted IR | 152.0 | 107.4 | 70.7% | 35.4% |
| atm. emitted IR - sides (-55°C) | 129.0 | 90.9 | 70.5% | 59.9% |
| atm. emitted IR - above (at 12km) | 20.0 | 14.4 | 72.0% | 4.7% |
| thermal equilibrium | -42.5°C | 953.8W | 100.0% |
Another scenario is a cloudless night. Aside from omitting the solar radiation, the ground emitted infrared radiation was decreased to the lower limit provided by Lally to examine a more extreme situation. This time the upper limit for the film temperature fell to -42.5°C, still 12.5°C above the ambient air temperature.
| CLOUDY DAY | Pt (W/m2) | Pa (W/m2) | absorbed | contribution |
|---|---|---|---|---|
| direct solar (10% cirrus reduction) | 1229.4 | 276.4 | 22.5% | 27.5% |
| lower clouds reflected solar | 720.0 | 161.9 | 22.5% | 16.1% |
| lower clouds emitted IR (5°C) | 340.0 | 246.4 | 72.5% | 24.5% |
| upper clouds emitted IR (-30°C) | 198.0 | 139.5 | 70.5% | 13.8% |
| atm. emitted IR - sides (-55°C) | 129.0 | 90.9 | 70.5% | 18.1% |
| thermal equilibrium | 38.0°C | 3160.5W | 100.0% |
A scenario with a continuous cloud cover underneath the balloon and a presence of high cirrus clouds seems to be among the more demanding conditions to encounter. Particularly due to the additional solar reflection and more prominent contribution from above in the form of a much warmer IR emitter than was the clear sky in the first example. This time the upper limit for supertemperature rose as high as 93°C.
| CLOUDY NIGHT | Pt (W/m2) | Pa (W/m2) | absorbed | contribution |
|---|---|---|---|---|
| lower clouds emitted IR (5°C) | 340.0 | 246.4 | 72.5% | 43.4% |
| upper clouds emitted IR (-30°C) | 198.0 | 139.5 | 70.5% | 24.6% |
| atm. emitted IR - sides (-55°C) | 129.0 | 90.9 | 70.5% | 32.0% |
| thermal equilibrium | -3.5°C | 1783.5W | 100.0% |
During a cloudy night the balloon would also operate quite pressurized with the upper limit at 51.5°C of supertemperature. All the radiation flux values used in these scenarios represent only a limited collection of examples for illustratory purposes. Reality provides a much wider spectrum of situations. The radiation analysis also highlights my previous misunderstanding of Table 9 in Lally, Vincent E. Superpressure Balloons for Horizontal Soundings of the Atmosphere. NCAR, 1967 which provides maximum daytime temperature increase values for different altitudes. I originally considered those to be the total supertemperature not realizing the balloon wasn't at thermal equilibrium with the ambient air during the night.
| scenario | Mylar 92D | metallized | high ε in IR |
|---|---|---|---|
| clear day | 9.7°C | 173.7°C | -30.4°C |
| clear night | -42.5°C | -64.5°C | -61.3°C |
| cloudy day | 38.0°C | 211.3°C | -5.1°C |
| cloudy night | -3.5°C | -29.8°C | -26.1°C |
This table compares three materials of different absorptivity, reflectivity and transmittivity in a context of the previous four scenarios. First is the hypothetical Mylar 92D based material with averaged absorptivity in visible wavelengths $\alpha_{vis} = 0.12$, averaged absorptivity in infrared $\alpha_{ir} = 0.47$, and averaged emissivity in infrared $\varepsilon_{ir} = 0.47$. The second material represents a metallized, highly reflective film both in visible and infrared - $\alpha_{vis} = 0.06 $, $ \alpha_{ir} = 0.01 $, $ \varepsilon_{ir} = 0.01$. The problem with these surfaces is that they are poor emitters which leads to extreme heating during the day. The envelope has to reach temperatures in range of 200°C to be able to radiate as much power as it absorbs. The third case is an example of a hypothetical material relatively transparent in visible wavelengths and highly emissive in infrared - $\alpha_{vis} = 0.08 $, $ \alpha_{ir} = 0.90 $, $ \varepsilon_{ir} = 0.90$. The high emissivity allows the film to stay relatively close to the ambient temperature (-55°C). However, in the case of the clear night scenario, it could lead to cooling the gas below ambient temperature (supertemperature of -6.3°C) decreasing its lift, and potentially bringing the balloon down.
| r (m) | spfl (Pa) | sp64.7 (Pa) | σ (MPa) | sp12.5 (Pa) | σ (MPa) | sp93.0 (Pa) | σ (MPa) | sp51.5 (Pa) | σ (MPa) |
|---|---|---|---|---|---|---|---|---|---|
| 0.25 | 3955 | 15794 | 85.8 | 6243 | 33.9 | 20973 | 114.0 | 13379 | 72.7 |
| 0.50 | 931 | 5438 | 59.1 | 1802 | 19.6 | 7409 | 80.5 | 4518 | 49.1 |
| 0.75 | 453 | 3262 | 53.2 | 996 | 16.2 | 4491 | 73.2 | 2689 | 43.8 |
| 1.00 | 275 | 2324 | 50.5 | 671 | 14.6 | 3221 | 70.0 | 1906 | 41.4 |
This table summarizes the effect of supertemperature on superpressure and consequently on stress in the material. Four sizes of an idealized sphere made of the hypothetical 23μm Mylar 92D material were confronted with the upper limits for supertemperature from the previous four scenarios. They were modelled as lifting 10g payload at initial ascent rate of 1m/s. The second column holds the amounts of superpressure experienced by individual balloons only due to the free lift (the excess amount of gas). The following columns then address the superpressure and stress values at the marked supertemperature levels (ambient air -55°C, film temperature 9.7°C, supertemperature 64.7°C).
| r (m) | V (m3) | mg (kg) | Alt. (m) | P (Pa) | T (°C) | ST (°C) |
|---|---|---|---|---|---|---|
| 0.25 | 0.065 | 0.00290 | 7131 | 40289 | -31.4 | -21.6 |
| 0.50 | 0.524 | 0.00884 | 13968 | 14159 | -56.5 | -13.4 |
| 0.75 | 1.767 | 0.01861 | 16872 | 8954 | -56.5 | -10.4 |
| 1.00 | 4.189 | 0.03217 | 18818 | 6587 | -56.5 | -8.7 |
As long as a balloon is pressurized, the density of the system stays the same (ignoring any potential stretching of the envelope due to stress), and the balloon floats along the same air density level. If, however, the lifting gas cools down with respect to the air temperature, the pressure inside the balloon will decrease. Below a certain temperature the weight of the system becomes higher than the upward force generated by the gas, and the balloon starts to descend. It will keep descending as long as the supertemperature stays below this limit. If the temperature of the gas rises above the limit, the balloon will ascend back to its float altitude. The amount of supertemperature, positive or negative, then determines the ascent/descent rate. $$ T_g = \frac{ V P}{m_g R_g} $$ This equation, where $R_g = 4124 \: J \cdot kg^{-1} \cdot K^{-1}$ for hydrogen, gives the absolute temperature of the limit in kelvin. The table above illustrates these limits for four different sizes of balloons (1m/s initial ascent rate, 10g payload). The pressure and temperature columns correspond to standard atmosphere model at respective float altitude. The last column then represents the amount of negative supertemperature at which the balloon starts to descend. In other words, the temperature of the gas must be more than 21.6°C below the air temperature (-31.4°C) in case of the smallest balloon.
Another factor limiting a superpressure balloon's lifetime is gas loss due to diffusion through the material. Datasheets often provide permeability figures of the material for different gases. In case of a balloon, there is a limiting amount of gas lost after which the balloon loses its lift and descends. It can be estimated for different envelope sizes with this equation: $$ \% \: Gas \: Loss \: = \frac{m_{fl}}{m_{fl}+m_b+m_p} \cdot 100$$ where $m_{fl}$ represents the free lift, $m_b$ is the balloon mass, and $m_p$ is the mass of the payload. The resulting percentage then represents the fraction of $m_g$, the actual mass of the gas in kilograms, the balloon can lose before it starts to descend.
| Material | Thick. | Conditions | O2 | He | H2 |
|---|---|---|---|---|---|
| Mylar | 23μm | 25°C | 76.0 | 2229 | 1521 |
| Heptax | 25μm | 20°C 60%RH | 6.9 | 800 | |
| PE/EVOH/PE | 40μm | 23°C 50%RH | 3.5 | ||
| PE/PA/EVOH/PA/PE | 50μm | 23°C 0%RH | 2.8 |
The most frequent figure I came across is a material's permeability to oxygen which isn't much of a use in actual balloon's operating life estimate, but it may at least indicate how it compares to other materials as a general gas barrier. Some sources, luckily, provide hydrogen and helium permeability figures as well. The table above contains these converted to common units of $cm^3 \cdot m^{-2} \cdot atm^{-1} \cdot day^{-1}$. The figures slightly differ in conditions at which they are said they were measured. According to Lally, permeability decreases with temperature. He then provides a table of measured Mylar permeabilities to helium at a wide range of temperatures (Table 3 in Superpressure Balloons for Horizontal Soundings of the Atmosphere). $$ Rate\,of\,loss\,= \frac{\delta p A}{t}$$ this equation computes the amount of gas in $cm^3$ that diffuses through an area $A$ per day. The permeability of the material is specified by $\delta$, $p$ then represents the partial pressure of the gas across the film, and $t$ is the film thickness.


The permeability's dependence on temperature seems to be the dominant factor in slowing down the diffusion. This should favour transparent, highly emissive films in infrared over metallized envelopes. Further, larger balloons are advantageous from two standpoints. The amount of gas lost per day constitutes a smaller fraction of the total amount of gas. And the partial pressure of the lifting gas is lower than in a smaller envelope. This section dealt with gas diffusion through the material only. Gas loss may be further intensified due to microleaks - microscopic holes in the material.
| Mylar 92A | Heptax | TR9 | TR9 | TRB40 | |
|---|---|---|---|---|---|
| Thickness (μm) | 23 | 25 | 40 | 50 | 40 |
| Density (kg/m3) | 1390 | 953 | 972 | 976 | 945 |
| Tensile Strength (MPa) - TD | 234 | 100 | 30 | 30 | 22 |
| Tensile Strength (MPa) - MD | 200 | 102 | 26 | 26 | 18 |
| Elongation at Break (%) - TD | 91 | 90 | 400 | 400 | 400 |
| Elongation at Break (%) - MD | 116 | 153 | 450 | 450 | 400 |
| Modulus (MPa) - TD | 5102 | ||||
| Modulus (MPa) - MD | 3378 | ||||
| Poission's Ratio (before yield) | 0.38 | ||||
| Poission's Ratio (after yield) | 0.58 | ||||
| Thermal Weldability (°C) | 125-160 | 125-160 | 120-160 | ||
| Melt Point (°C) | 254 | ||||
| Haze (%) | 16 | 3 | |||
| Transmittance (visible) | 0.9 | ||||
| OTR (cm3m-2atm-1day-1) | 76.0 | 6.9 | 2.5-3.0 | 2.5-3.0 | 3.0-4.0 |
| He perm. (cm3m-2atm-1day-1) | 2229 | 800 | |||
| H perm. (cm3m-2atm-1day-1) | 1521 |
This table contains specifications of several films for comparison. I haven't managed to obtain all the data for all the films. TR9 is the 50μm PE/PA/EVOH/PA/PE film I used on TT7F balloons. TRB40 is a PE/EVOH/PE material I started with when making balloons, but I've never actually launched any of those. Mylar 92A is one of a wide range of BoPETs - biaxially-oriented polyethylene terephthalates. Other Mylar types, aside from a number of thicknesses, offer different degrees of haze, or the possibility of a metallized finish. Apparently, not all Mylar films are heat sealable. Heptax is said to be a clear 7-layered film coextruded from nylon, EVOH and LLDPE that has been successfully used on balloons and blimps.
Another referenced potential cause of superpressure balloon failure is the accumulation of ice on the envelope. Too much icing negatively impacts the total mass of the system and may lead to loss of lift. At target altitudes above 10km, balloons don't encounter that many clouds, thus the main threat lies in the ascent portion of the flight. The simplest way to limit potential sources of icing is choosing the right conditions to launch, ideally clear skies.
All the previous examples assumed idealized spheres for the modelled balloons. In reality, however, the inflated shapes aren't spherical and stress isn't distributed evenly. Depending on the actual shape, the material is at some places stressed and deformed more than the idealized computation suggests, and this needs to be taken into account. Balloons made of two circular pieces of film are stressed the most in the centre of the circular shapes while the circumferential weld rests along a relatively unstrained spot. In case of the tube, or cylindrical shaped balloon, the main stress is concentrated in the middle of the body with the welds being stressed slightly less than the centre of the piece of film.
In light of the TT7F flights, I would say that to better assess an envelope's performance, it would be preferable to design a simple low power tracker that runs on a primary cell (non-rechargeable, e.g., Li-FeS2). The lifetime would be limited, but the primary cell's superior low temperature performance could provide an overnight coverage of the balloon's behaviour.
Practical Notes
Over the course of making the balloons, I encountered several issues. Mainly because of the heat sealer I used. The following paragraphs describe what I dealt with.


I wondered about how Qualatex do their welding on the 36" party balloons they sell. I then came across several Youtube videos showing the machines that do the mass production of foil balloons. From those, it seemed there was a form for the whole balloon shape that does all the welds at once and cuts the whole shape out at the same time. Based on that people have flown these balloons around the world, it probably produces consistent and reliable welds, but it is limited in the maximum balloon size by the machine's dimensions.
Having undergone ordeal with the impulse heat sealer, and knowing about people having a go at constructing custom sealing machines, I thought about how I picture a homemade device. Ideally, it would allow the film to continue beyond both ends of the wire without bending. Meaning, the hinge of the pressing arm would be parallel to the wire. The length of the heating element would probably depend on intended balloon shape and size, but generally with the possibility of easily doing welds length after length it wouldn't have to be any longer then the 30cm of the impulse heat sealer. The width of the wire ideally towards 10mm, so doing single weld is enough. The heating time could be derived from testing for a specific film. Heat dissipation may be an issue as it is on the impulse heat sealer. What I would like to add is some form of feedback on the weld quality. Perhaps sampling the current running through the circuit, or a thermocouple on the heating wire to provide a weld to weld comparison.
I have done most of my seam welds with a handheld heat sealer with smooth wheel.
ReplyDeleteIt takes experimenting and practice but is reasonably reliable in the end.
Leo Bodnar
Interesting. When I first saw those heat sealers, I thought it may be problematic to achieve consistent pressure and welding duration over the whole weld. But your balloons certainly proved otherwise.
ReplyDeleteWhere did you get the mylar. Can you plz give me the details?
ReplyDeleteI never had any Mylar. The data on Mylar were taken from datasheets and documents.
ReplyDeleteHello friends, I am just now getting into learning the partial pressure balloon making craft. Probably going towards a larger balloon for Bill Brown's 12 gram versatile payload. Are there more current, or ongoing discussion groups on-line to learn from? best, Pat Barthelow apolloeme@gmail.com Auburn California.
ReplyDeleteAvailable in different forms such as low-density (LDPE) and high-density (HDPE), PE Film can be customized in terms of thickness, transparency, and size to suit specific requirements.
ReplyDelete